ClickUp Dashboards vs Google Sheets: Which Report Belongs Where

A Dashboard can only reason about data ClickUp holds. Which reports belong in ClickUp, which belong in Google Sheets, and what the card export actually costs.

Title card comparing a ClickUp Dashboard with a Google Sheets pivot report on a dark background

ClickUp Dashboards are good. The cards are quick to assemble, they are live by construction, and for the questions ClickUp anticipated they beat any spreadsheet you would build.

The reason teams keep ending up in Sheets anyway is narrow and consistent: a Dashboard can only reason about things ClickUp knows. The moment your report joins task data to something outside ClickUp, the Dashboard runs out of vocabulary.

Dashboard strengths

Live by default. No sync, no schedule, no staleness. A card is a query against the workspace.

Drill-through. Click a number and you land on the tasks behind it. A spreadsheet number is a dead end unless you built a link column.

No field mapping. Add a custom field in ClickUp and the card can use it immediately. A synced sheet needs the column added.

Time in Status, Sprint velocity, workload. ClickUp computes these from data it holds and you would have to reconstruct. Time in Status in particular is derived from a status history a sync does not carry.

Permissions follow the workspace. A person who cannot see a Space cannot see it on the Dashboard either. In a spreadsheet, sharing is a separate decision you have to get right by hand.

Dashboard costs

Free Forever gets trial access: 60 Dashboard uses in total, counting both opening one and editing a card, on a counter that never resets. The Unlimited plan, at $7 per user per month billed annually, lifts that cap.

Cards are tiered again on top of the plan. Free cards are on every plan, Standard cards start at Unlimited, and Advanced cards start at Business, at $12 per user per month billed annually. Exporting a card's data as CSV, PDF, PNG, JPEG, or SVG is Business as well.

The reporting a spreadsheet replaces is therefore the paid part of ClickUp. The Free plan limits put those numbers next to the 5-export cap, which is the other reason Free and Unlimited workspaces end up reporting out of Sheets.

Spreadsheet strengths

Joins to things ClickUp does not know. Rate cards. Contracted hours. Budget by client. Revenue targets. Headcount plans. Invoice dates. None of these are ClickUp concepts, and every one of them is one tab away in a spreadsheet.

Arbitrary maths. Utilization against contracted hours, margin per project, a weighted forecast, a burn rate against a budget that lives in finance's model. SUMPRODUCT and QUERY will do things no card offers.

History that ClickUp overwrites. A ClickUp field holds its current value. If you want to know what the pipeline looked like on the first of every month, you need snapshots, and a sheet that appends a dated copy each month is the simplest snapshot store there is.

Sharing outside the workspace. A client can open a Google Sheet. Giving them a ClickUp Dashboard means a guest seat and exposure to a hierarchy you probably do not want them in. Sharing ClickUp data with clients covers that trade in full.

Charts people can actually edit. A stakeholder who wants the bars grouped differently can do it themselves in Sheets.

Cost. A spreadsheet is included with the Google Workspace you already pay for, at every tier, with no per-card gate.
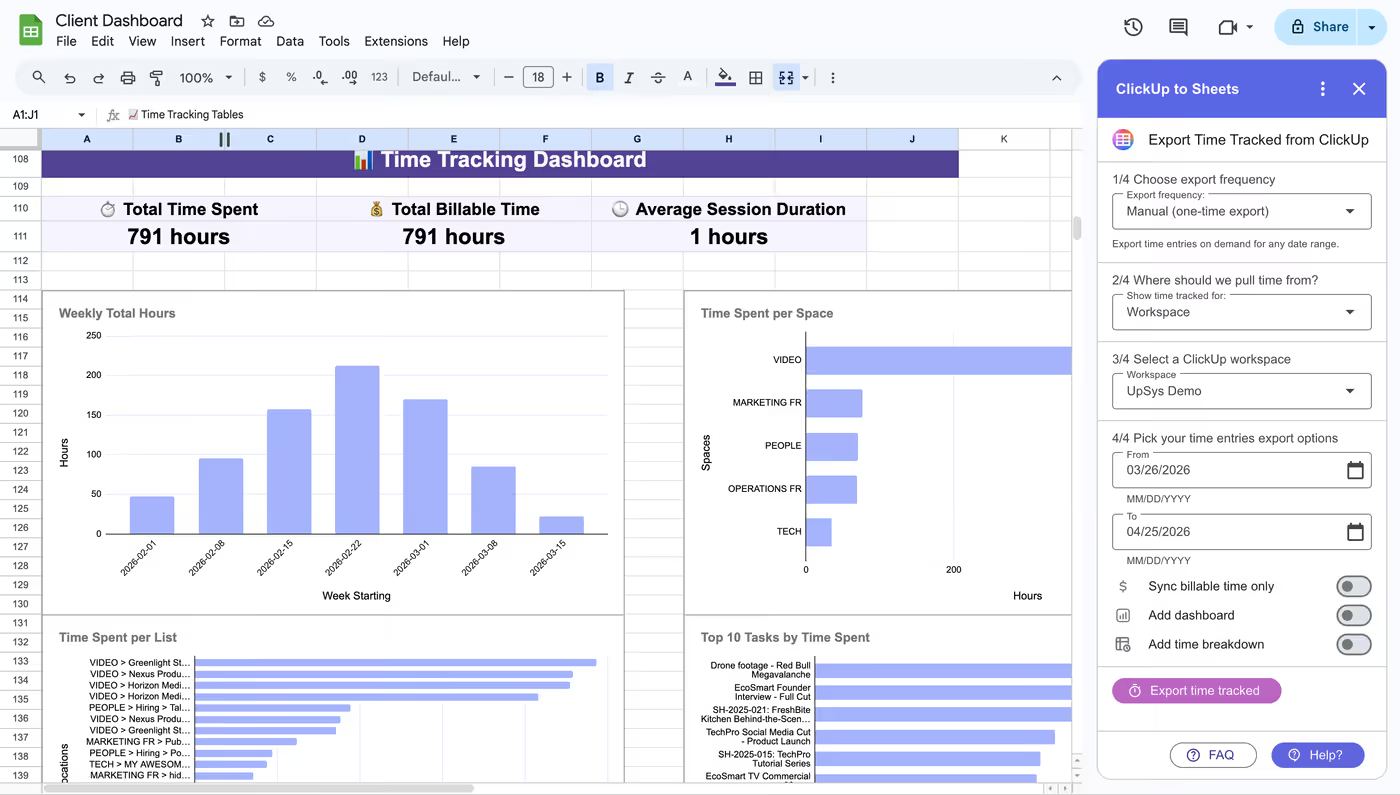
A reporting tab in Google Sheets built on synced ClickUp data, with scorecards for total time spent, billable time and average session duration above bar charts of weekly hours, hours per Space and hours per List
The raw ClickUp rows land on one tab. The charts and the joins live on another, and refreshes leave them alone.

Drawing the line

A rule that holds up in practice: if the answer only needs data ClickUp holds, build it in ClickUp.

Question Belongs in
How many tasks are open per assignee? Dashboard
What is our sprint velocity? Dashboard
How long do tasks sit in Review? Dashboard, Time in Status
What is our workload next week? Dashboard
What did we bill each client this month? Sheets, joined to a rate card
Are we above or below budget on this project? Sheets, joined to a budget
What is our utilization against contracted hours? Sheets
How did the pipeline change month over month? Sheets, with snapshots
What goes on the client's monthly report? Sheets
What is the revenue forecast from this stage field? Sheets

Each row in the bottom half needs a number ClickUp has never heard of.

The exporting trap in between

There is a middle path that looks efficient and is not: build the card in ClickUp, export it as CSV, paste it into the spreadsheet, build the join there.

On Business and above, most Dashboard cards export as CSV, PDF, PNG, JPEG, or SVG. It works, once. Then it becomes a monthly chore, the paste lands one column off in month four, and the finance model that references the range silently reads the wrong column.

Anything that ends with a person pasting a file into a report every month has the same failure mode, and it is never noticed on the month it happens.

The alternative is a synced tab: the raw ClickUp rows land on one tab automatically, and the report on the next tab references them with formulas that never need re-pointing. That is the whole design. The joins, the rate card, and the chart stay where you built them, and the data underneath refreshes without anybody touching it.

Building it that way

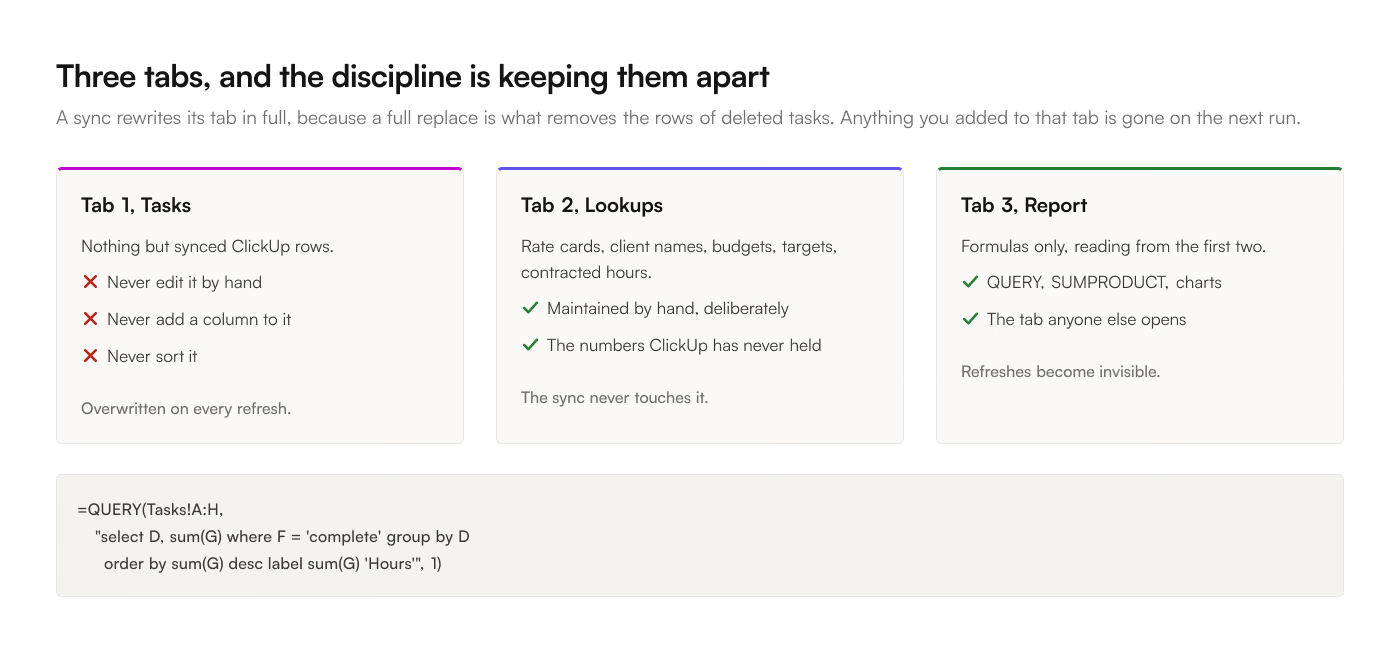
3 tabs, and the discipline is in keeping them separate.

Tab 1, Tasks. Nothing but synced ClickUp rows. Never edit it by hand, never add a column to it, never sort it. Whatever refreshes it will overwrite whatever you do.

Tab 2, Lookups. Rate cards, client names, budgets, targets, contracted hours. Maintain it by hand, deliberately.

Tab 3, Report. Formulas only, reading from the first two. This is the tab anyone else opens.

=QUERY(Tasks!A:H,
  "select D, sum(G) where F = 'complete' group by D
   order by sum(G) desc label sum(G) 'Hours'", 1)

The reason for the split is what happens on refresh. A sync rewrites Tasks in full, because a full replace is what removes rows for deleted tasks, and some deletions arrive no other way: ClickUp deletes a parent's subtasks without emitting an event for the children. Anything you added to that tab is gone on the next run. Keep your work on tabs the sync never touches and refreshes become invisible.

3 spreadsheet tabs with different jobs. Tasks holds synced ClickUp rows and is overwritten on every refresh. Lookups holds rate cards and budgets maintained by hand. Report holds the formulas reading from the first two, including the QUERY that groups hours by client

For the reporting patterns that pay for themselves fastest, building a ClickUp time tracking report in Google Sheets has the 3 queries most teams end up wanting.