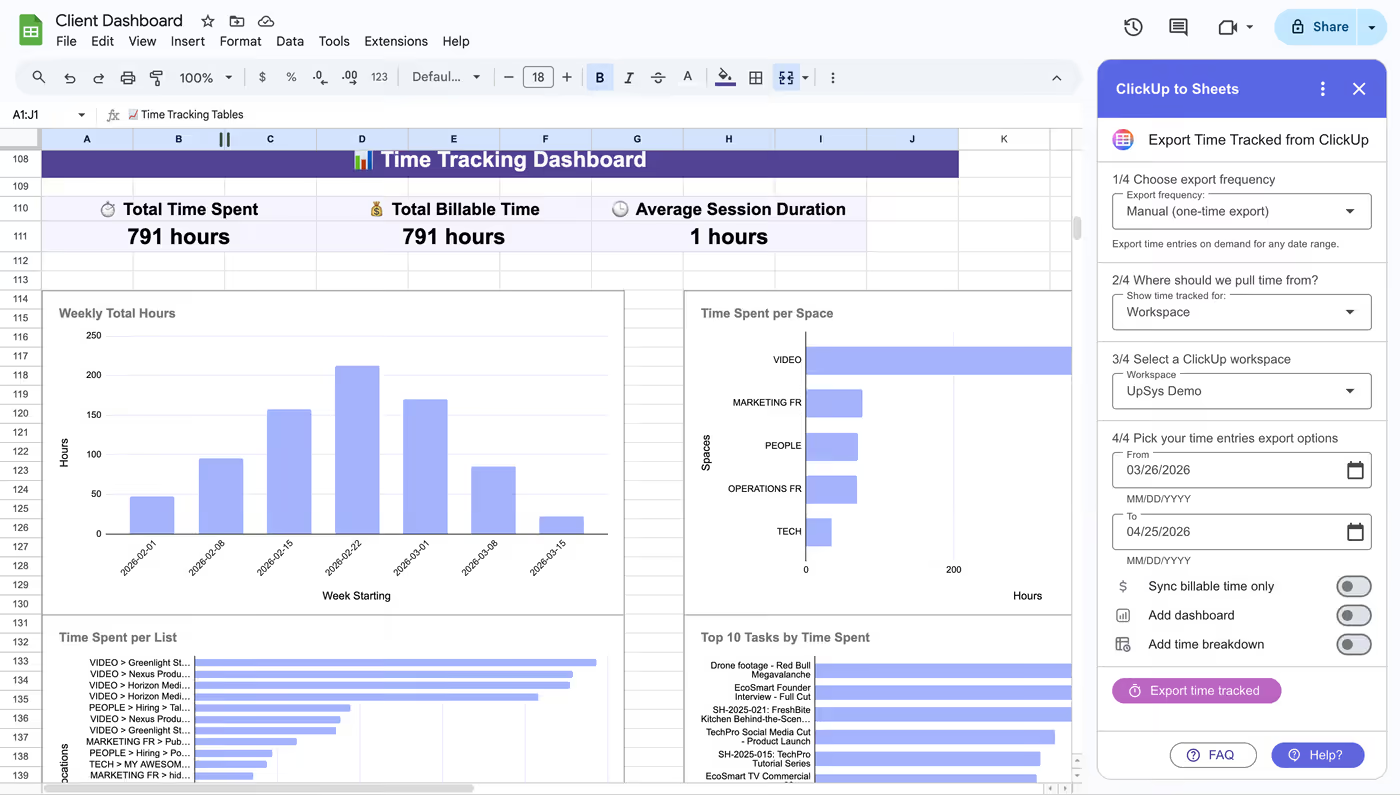
ClickUp's native time reports are fine for the questions ClickUp anticipated. Billable hours by person this month, time by List, time in status. The moment you need a rate card applied per client, a utilization percentage against contracted hours, or an invoice line grouped the way your accountant wants it, you are past what the built-in reports do.
Time entries in a spreadsheet solve all of those, because a spreadsheet is where rate cards and utilization targets already live. Getting them there is the part worth doing carefully.
Native time reporting coverage
Tracking itself runs on every plan: a timer on the task, manual entries, a duration and a note per entry. Free Forever caps the Time Tracking ClickApp at 60 uses in total, and those uses do not reset. Above Free you get:
- Time reporting and Timesheets, which roll entries up by person, by day, and by List. That is the weekly timesheet most teams are after.
- Billable rates and timesheet approvals, on Business at $12 per user per month billed annually.
- Dashboard time cards, which chart the same data live, with card data export on Business and above.
All of that reports time as ClickUp understands it. A rate that changes per client, an hours target per person, an invoice cut-off date, a margin per project: none of those are ClickUp fields, so a report that joins to them has to happen elsewhere. The Free plan limits lay out the rest of the ladder.
Time entry contents
A time entry is its own object, separate from the task. Through the API each one carries:
id, andwidfor the workspacetask, with the task's id, custom id, name, and statususer, with id, username, email, initialsstart,end, andduration, all in millisecondsbillable, a booleandescription, the note the person typed when they logged ittags, the labels on the entry itselfsource, how it was createdat, when the entry was recorded- optional
task_location,task_tags, andtask_url
Two of those matter more than the rest.
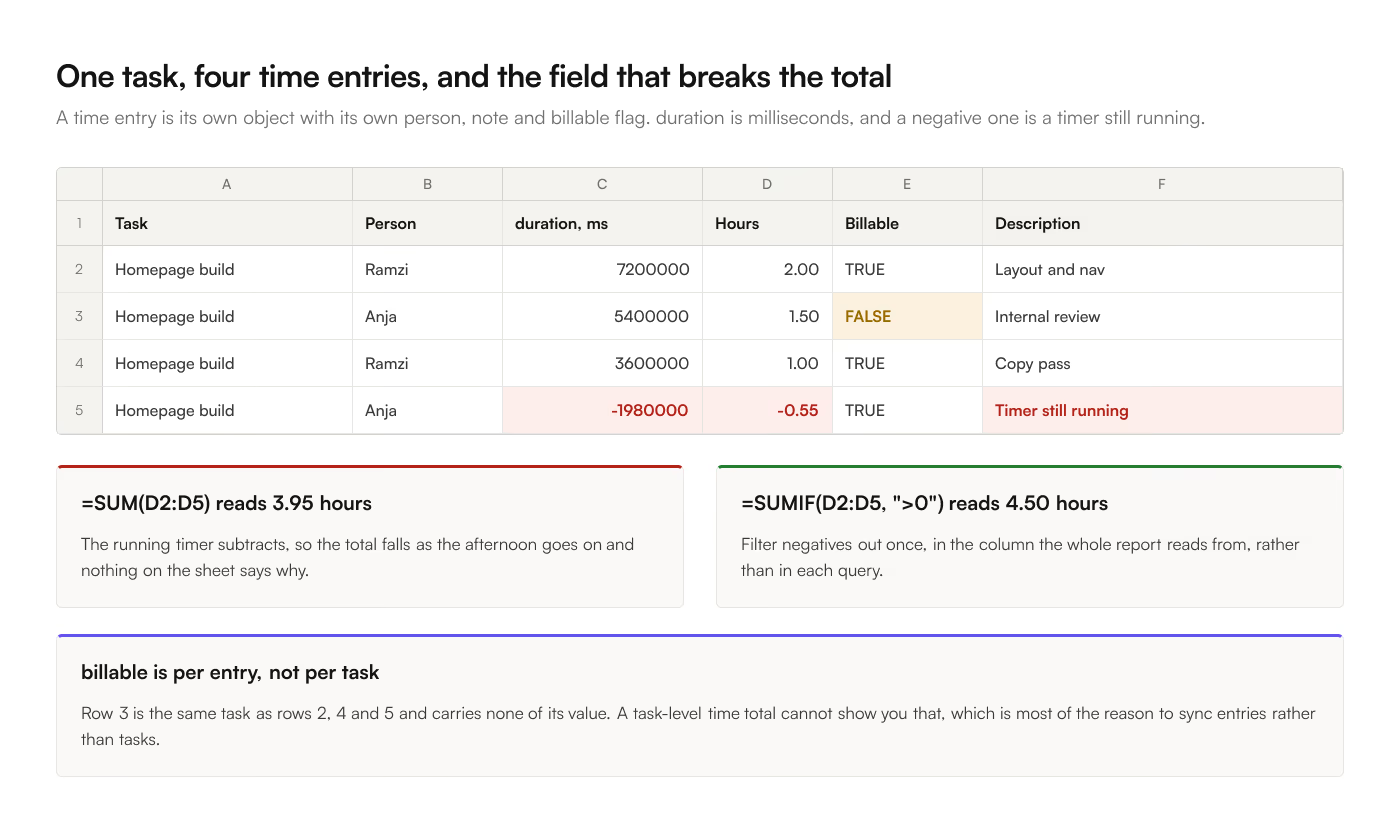
duration is in milliseconds, and a negative value means the timer is still running. An entry with a negative duration is somebody's clock ticking right now. Sum a column without filtering those out and your total goes down as the day goes on.
billable is per entry, not per task. The same task can carry billable and non-billable time, which is exactly what you want and exactly what a task-level report cannot show you.
Getting the entries out
3 routes move entries into Sheets. Pick one.
Through the API
The endpoint is GET /team/{team_id}/time_entries. The parameters that matter:
start_dateandend_date, both Unix milliseconds. Without them you get the last 30 days, authored by the authenticated user only, which is the most common reason a first attempt returns a suspiciously small number of rows.assignee, a user id, or several comma-separated. Pulling other people's entries requires admin or owner access.- One of
space_id,folder_id,list_id, ortask_idto narrow the location. One at a time; they do not combine. include_task_tagsandinclude_location_names, both worth turning on, because otherwise you get ids where you wanted the Space and Folder names and you will be joining them back yourself.
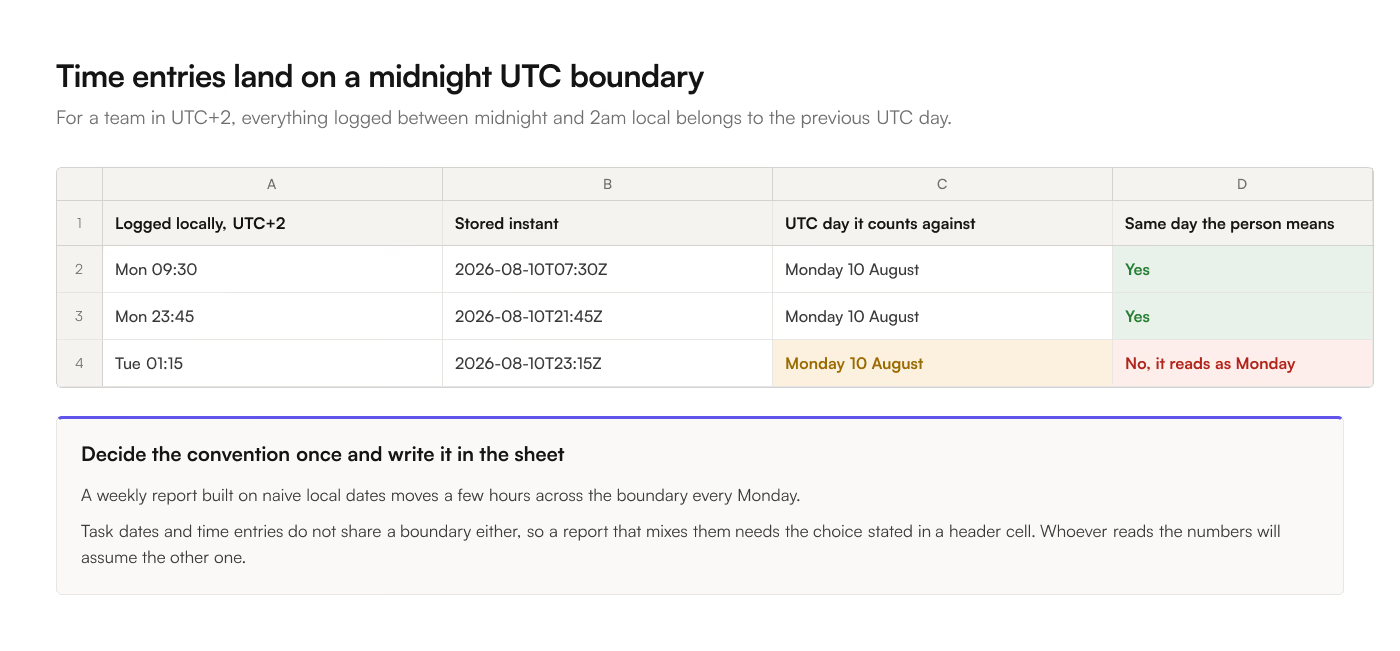
The date boundary is the detail that catches people. Time entries use a midnight UTC boundary. If your team is in UTC+2, the entries logged between midnight and 2am local belong to the previous UTC day, and a "this week" report built on naive local dates will move a few hours across the week boundary every Monday. Decide which convention your report uses and make it explicit in a header cell, because whoever reads the numbers will assume the other one.
Task dates follow a 4AM UTC boundary instead, which is a second convention living in the same spreadsheet the moment you put task rows next to entry rows. Filter each tab on its own boundary rather than on one shared date column. Why ClickUp dates come out wrong in Google Sheets covers the task side, including the 4am timestamps on all-day tasks.
Through the export
ClickUp's List and Table view export carries time tracked as a task-level total, not as individual entries. That is enough for "how long did this task take" and not enough for a timesheet, because the per-person, per-day, per-note breakdown is exactly what got collapsed.
If you export, set the Time Format to hh:mm rather than the 10h 5m default. 10:05 is a duration Google Sheets can sum; 10h 5m is a string you have to parse.
Through the add-on
ClickUp to Sheets syncs time entries as their own row type on the Pro plan and above, with the task, the person, the date, the duration, and the billable flag already split into columns. That is the shape the rest of this article assumes, because it is the shape you want whichever route you take.