ClickUp will happily show you that a task was estimated at 4 hours and took 11. That is a fact about one task and it changes nothing.
The question worth answering is which kinds of work you underestimate, by how much, and consistently enough to price differently next time. That is a question about distributions across the whole portfolio, joined to attributes ClickUp holds and to a rate card it does not. It belongs in a spreadsheet.
Getting the 2 numbers out
Estimated time is a task field, time_estimate in the API, stored in milliseconds. Granular estimates, where each assignee carries their own, are a Business-plan feature and appear per assignee rather than as a single number.
Tracked time is the sum of that task's time entries. Through the export it appears as a task-level total. Through the API you either read the rolled-up time_spent on the task or sum the entries yourself from GET /team/{team_id}/time_entries, which is what you want if the analysis needs to split by person or by day.
2 settings decide whether the export is usable:
- Time Format: hh:mm.
10:05 is a duration Sheets can sum; 10h 5m is a string you have to parse.
- All columns. Estimates come through whether or not the view shows them.
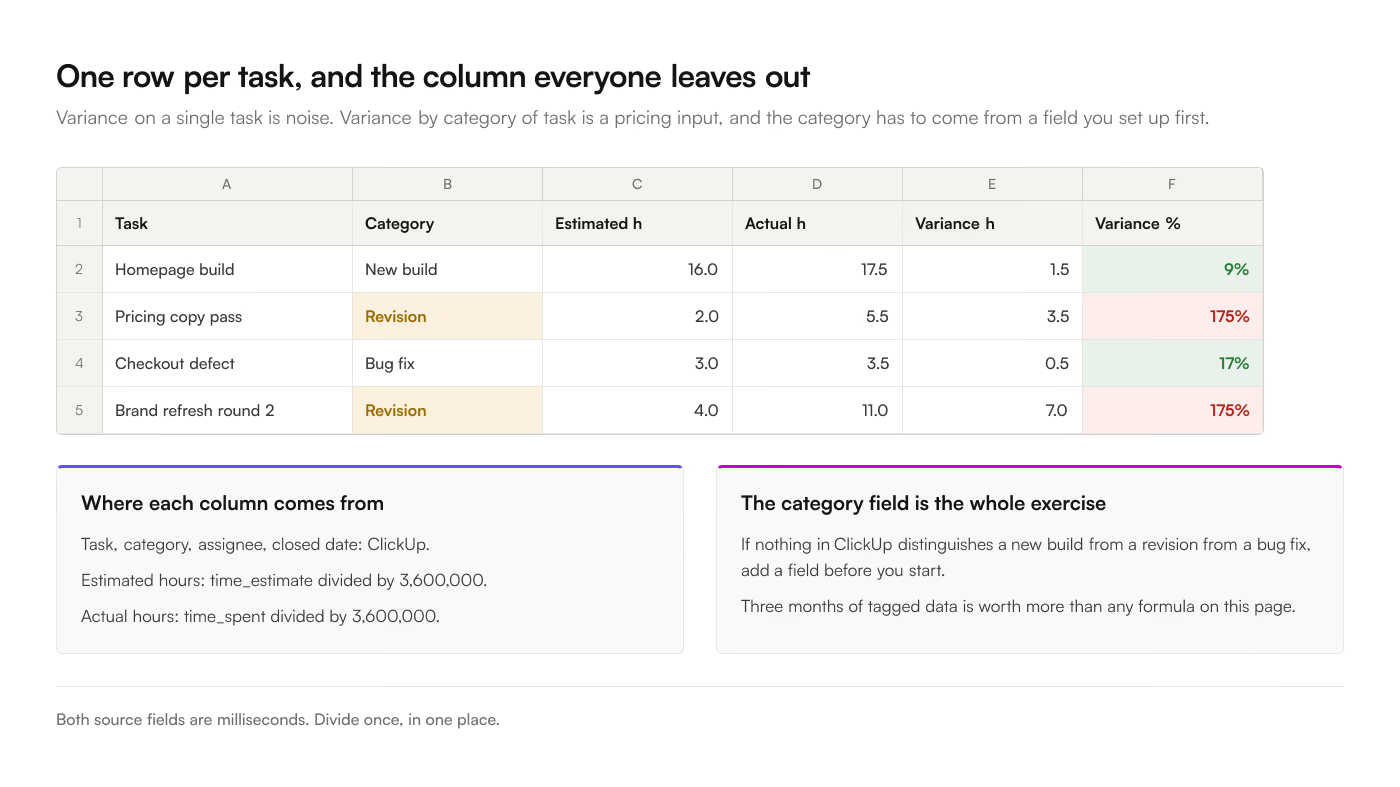
If you are pulling by API, remember both fields are milliseconds. Divide by 3,600,000 for hours and do it once, in one place.
The variance tab layout
One row per task, with:
| Column |
Source |
| Task name |
ClickUp |
| List or Space |
ClickUp, your project or client |
| Assignee |
ClickUp |
| Task type or a category field |
ClickUp custom field |
| Estimated hours |
time_estimate / 3600000 |
| Actual hours |
time_spent / 3600000 |
| Closed date |
ClickUp |
The category column is the one that matters and the one people leave out. Variance by task is noise. Variance by category of task is a finding. If you do not already have a field distinguishing "new build" from "revision" from "bug fix", add one in ClickUp before you start; 3 months of tagged data is worth more than any formula here. Getting ClickUp custom fields into Sheets covers what each field type looks like once it lands in a column.
2 rollups that make the totals lie
ClickUp has a Workspace-level Time Estimates Rollup, and a Time Tracking Rollup beside it. With rollup on, a parent task displays the sum of its own value and every subtask's, so a parent carrying no estimate of its own still shows 5 hours because 2 children carry 2 and 3.
That is useful in the interface and dangerous in a sheet. If your rows hold parents and children together, and the parent's figure already contains the children's, summing the column counts the same hours twice. Each category median built on top of it inherits the error.
2 behaviours decide whether it reaches you:
- List view showing subtasks as separate tasks does not include rolled-up estimates, so an export taken that way gives each task its own number.
- Workload and Team views never roll estimates up either, because capacity has to treat each task separately.
Check it once rather than reasoning about it. Sum the estimate column for one parent and its children, compare against what ClickUp shows on the parent, and write which convention you got into the header row.
The 4 calculations
4 formulas turn the tab into a report.
Variance, absolute and relative
Variance   =F2-E2
Variance % =IF(E2=0, "", (F2-E2)/E2)
Keep both. The absolute number tells you where the hours went. The percentage tells you how wrong the estimate was, which is the part that generalizes.
Median, not mean
=MEDIAN(FILTER(H:H, D:D="revision", E:E>0))
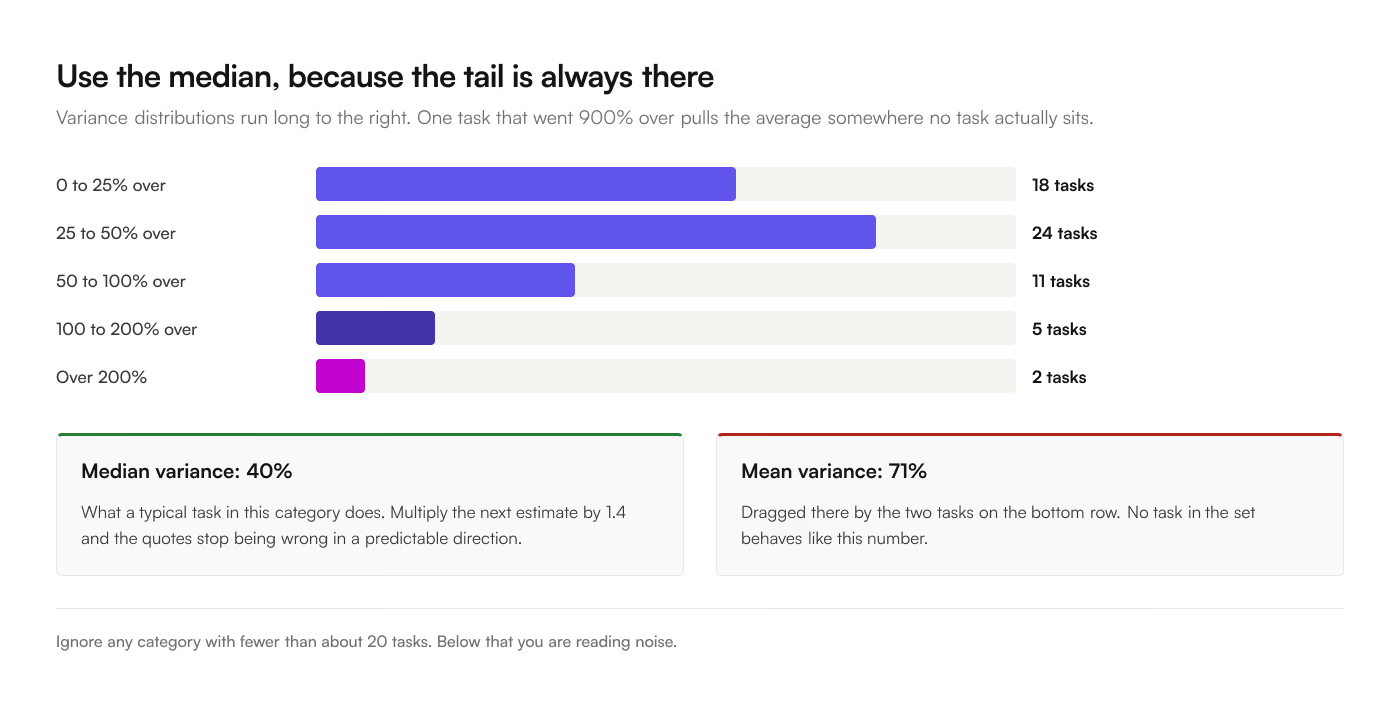
Use the median. One task that ran 900% over drags a mean into uselessness, and estimate-variance distributions always have that tail. The median tells you what a typical task does.
The systematic multiplier
=QUERY(A:H,
  "select D, count(A), median(H) where E > 0
   group by D order by median(H) desc
   label count(A) 'Tasks', median(H) 'Median variance'", 1)
This is the report. A category whose median variance sits at 40% across 60 tasks is not bad luck; it is a pricing input. Multiply your estimates for that category by 1.4 and your quotes stop being wrong in a predictable direction.
Ignore categories with fewer than about 20 tasks. Below that you are reading noise.
The cost of being wrong
With a rate card on another tab:
=SUMPRODUCT((Tasks!$D:$D=$A2) * (Tasks!$G:$G-Tasks!$F:$F) * VLOOKUP($A2, Rates!$A:$B, 2, FALSE))
Unbilled overrun in currency, per category. This is the number that changes behaviour, because "revisions run 40% over" is interesting and "revisions cost us £18,000 last year" ends the discussion.
4 things that will distort the answer
Tasks with no estimate. A task estimated at zero produces a division by zero or, worse, a variance of infinity that poisons an average. Filter to E2>0 in every calculation, and separately count how many tasks have no estimate at all. If it is most of them, that ratio is your actual finding.
Running timers. A negative duration in the time entries is a clock still going. =SUMIF(range, ">0") rather than =SUM(range).
Time logged against the parent instead of the subtask. People track wherever the timer is convenient. If your analysis groups by subtask and the hours sit on the parent, every subtask reads as free. Roll child time up to the parent with SUMIF on the parent id before comparing, and see the subtasks guide for getting the parent id into the sheet at all.
Estimates edited after the fact. Somebody revises the estimate upward when the task overruns, and the variance disappears. ClickUp holds only the current value, so a sync captures whatever the estimate is today. If this happens on your team, snapshot the estimate column monthly onto a dated tab; a sheet that appends a copy each month is the cheapest history store there is, and nothing else will recover it.
Dashboard card limits
ClickUp Dashboards compare estimate and tracked well at the task and List level. What they cannot do is join to a rate card, compute a median across a filtered category, or compare this quarter's distribution to last quarter's, because those need data ClickUp has never held and history it overwrites.
The split that works: raw task rows sync into one tab, your rate card and category definitions live on a second, and the variance report is formulas on a third. ClickUp Dashboards compared with Google Sheets reporting covers where that line falls in general, and the time tracking report guide has the queries for billing and utilization built the same way.